Our Solutions | Reporting
Make smarter decisions with rental reporting and business intelligence
Gain deeper insights into your rental business’ strengths and weaknesses with powerful rental reporting tools that help you make more informed, strategic decisions.
Rental Reporting Built for Your Success
Comprehensive Reporting
Easily access, summarise, and interpret key business data. Use pre-configured business intelligence reports or create custom rental reports tailored to your specific needs, with the option to automatically send them to your team.

Business Intelligence
Unlock a deeper understanding of your rental business with real-time analysis via Microsoft Excel pivot tables. With up-to-date, accurate data at your fingertips, you can make confident decisions that fuel business growth.

Dashboards
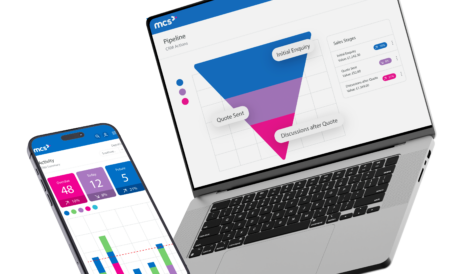
Visualise your business data in a user-friendly format with Power BI. These powerful data dashboards provide actionable insights into key metrics, helping you track business performance in real-time.

Why Do You Need MCS Rental Reporting Software?
MCS’ business intelligence reporting software offers a comprehensive, easy-to-use approach to understanding your rental business data, empowering you to make informed decisions that drive growth.

In-Depth Reports
Access over 50 standard reports, Access over 50 standard reports covering all aspects of your business, from utilisation to customer turnover. The intuitive interface allows you to summarise key business data and customise reports with your company branding.

Deeper Insights
Instantly analyse critical business areas through simple Power BI dashboards. View key data such as your top customers and revenue by equipment group, monitor asset utilisation averages, and track projected values by month or quarter.

Better Visibility
Extract raw data and explore core business strengths and weaknesses. With Microsoft Excel pivot tables, you can delve into key information such as customer spend, sales performance, fleet performance, equipment costs, and hiring trends.

Smarter Investments
Make more informed purchasing decisions by leveraging detailed data. Rental equipment reporting helps you identify high-performing assets and those with higher downtime, guiding your investment strategy.


Case studies

Buildequip Hire & Sales

Terideal

John F Hunt

Portable Toilets

Nixon Hire

HE Services

Fowler Hire & Sales

First Response Site Services

Baldwins Crane Hire Ltd

Profirent
Ready to elevate your rental business?
Connect with our expert team to discover how MCS Rental Software can drive your success. We’re here to answer your questions and help you find the perfect solution.
